
Debug transaction methods#
Transaction methods form the backbone of your solution’s backend logic. This debugging mode allows you to set breakpoints and step through your backend Python code as it executes.
Prerequisites#
Before setting up debugging, ensure you have:
Installed the Python extension in VS Code (see Prerequisites)
Opened a single solution (see Single-solution debugging) or a multi-root workspace with multiple solutions (see Multi-solution debugging)
Verified the
.vscode/launch.jsonfile at the root of the solution folder (see Prerequisites)Verified that the
.vscode/launch.jsonfile contains the Python: Remote Attach debug configuration
Debugging workflow#
Step 1: Run in debug mode#
Run the solution in debug mode using SAF CLI:
Open the solution folder directly in VS Code:
code path/to/my-solutionRun the solution with the
--debugflag:saf run --debug
Run the solution in debug mode using Solutions Manager:
Open Visual Studio Code.
In the Activity Bar, click the Solutions Manager icon.
In the Solutions Manager pane, expand the Run Solution view.
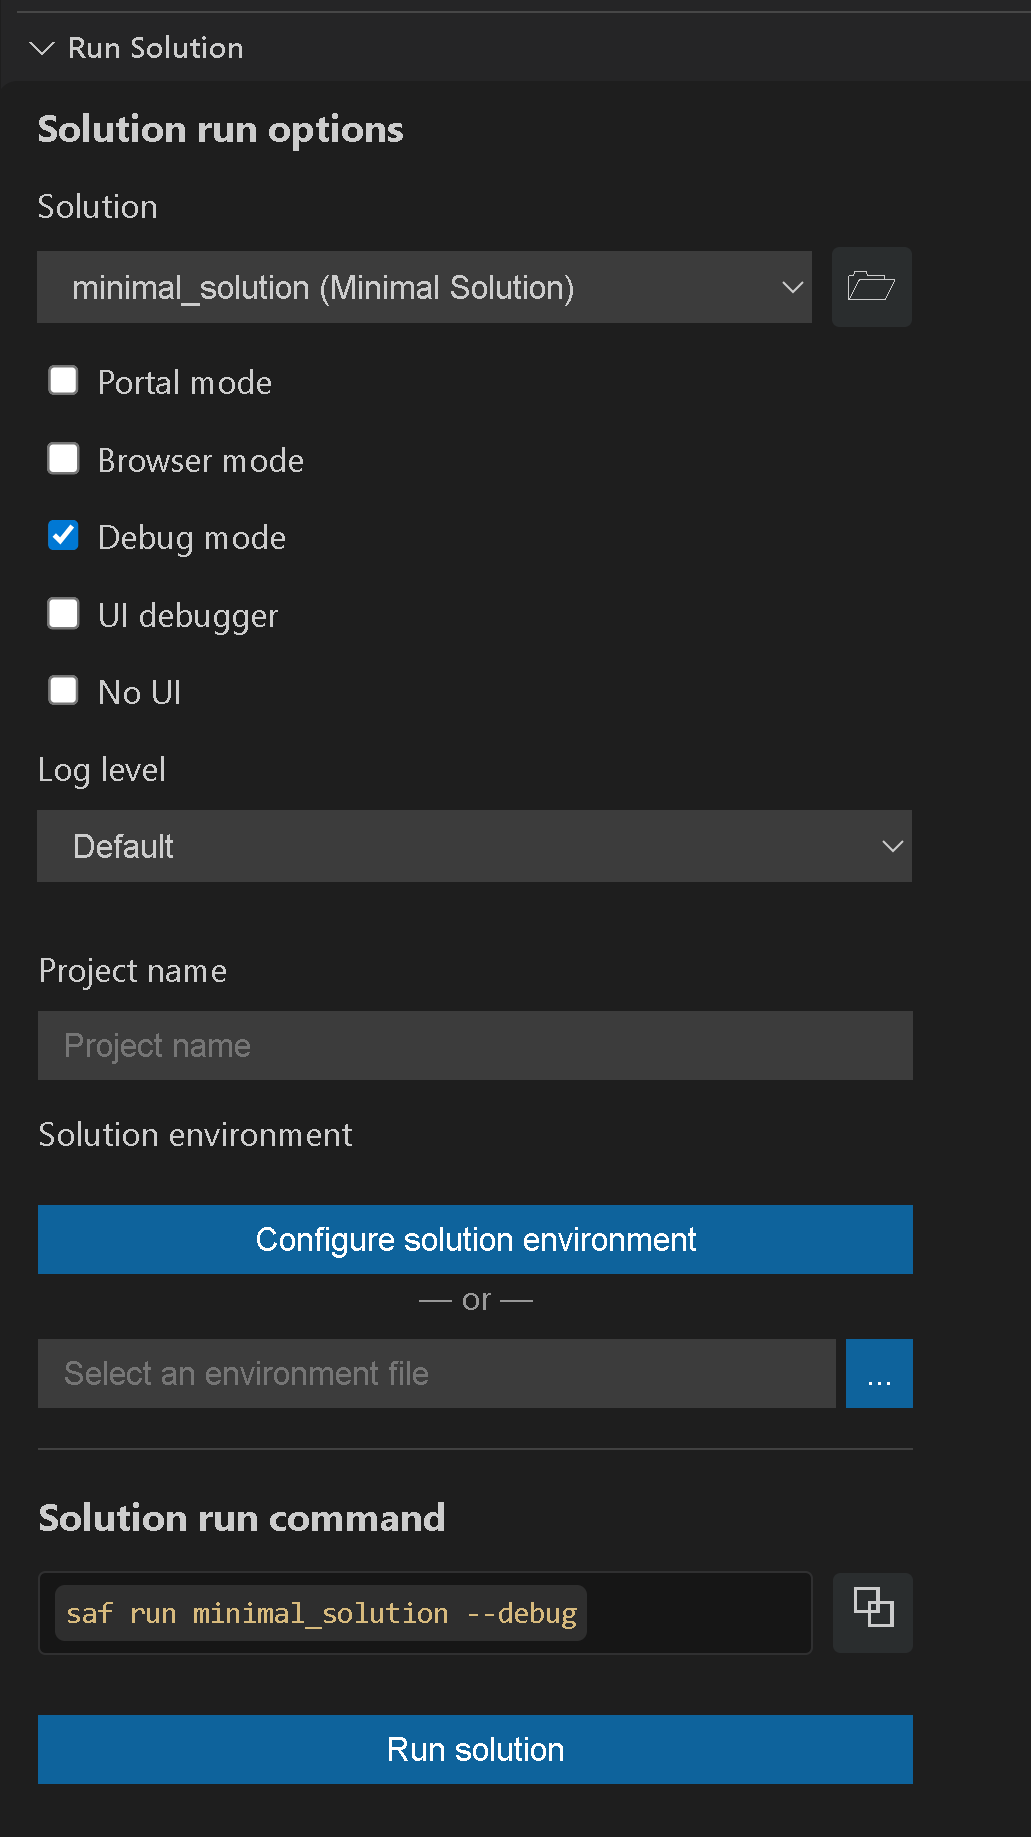
Provide the following values:
Select the solution you want to debug.
When selecting your run options, ensure that Debug mode is selected.
Provide other values as needed. For more information, see Run a solution on desktop.
Run the solution.
Click the Run solution button. Alternatively, you can copy the command under Solution run command and run it in the terminal.
The solution runs in debug mode and the output is displayed in the terminal.
Result
When the solution is run, it performs the following actions:
Enables Python debugging in the solution API server process.
Starts
debugpylistening on port5724or the next available port and logs the port to the terminal.Enables Uvicorn hot-reload when configured (controlled by
GLOW_API_HOT_RELOAD, enabled by default).
Tip
Instead of using the --debug flag, you can enable debug mode by setting the GLOW_DEBUG
environment variable to any value. This starts solutions in debug mode automatically, eliminating
the need to specify the --debug flag each time you run a solution.
$env:GLOW_DEBUG = "True"
set GLOW_DEBUG=True
export GLOW_DEBUG=True
Step 2: Attach the debugger#
Wait for the solution API server to start. The output should contain a line similar to:
INFO - Starting Solution API...
Open the Run and Debug panel by pressing Ctrl+Shift+D
In the Search configurations menu, select Python: Remote Attach (if it is not already selected.)
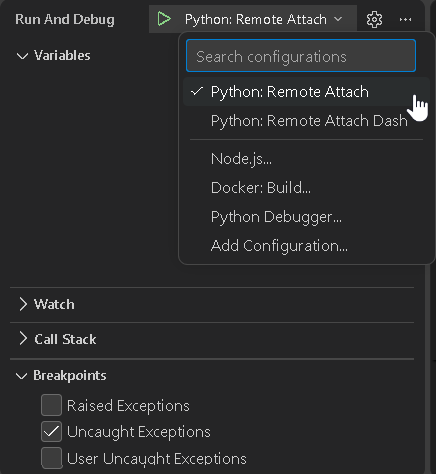
Press F5 or click the green Start Debugging button to attach the debugger.
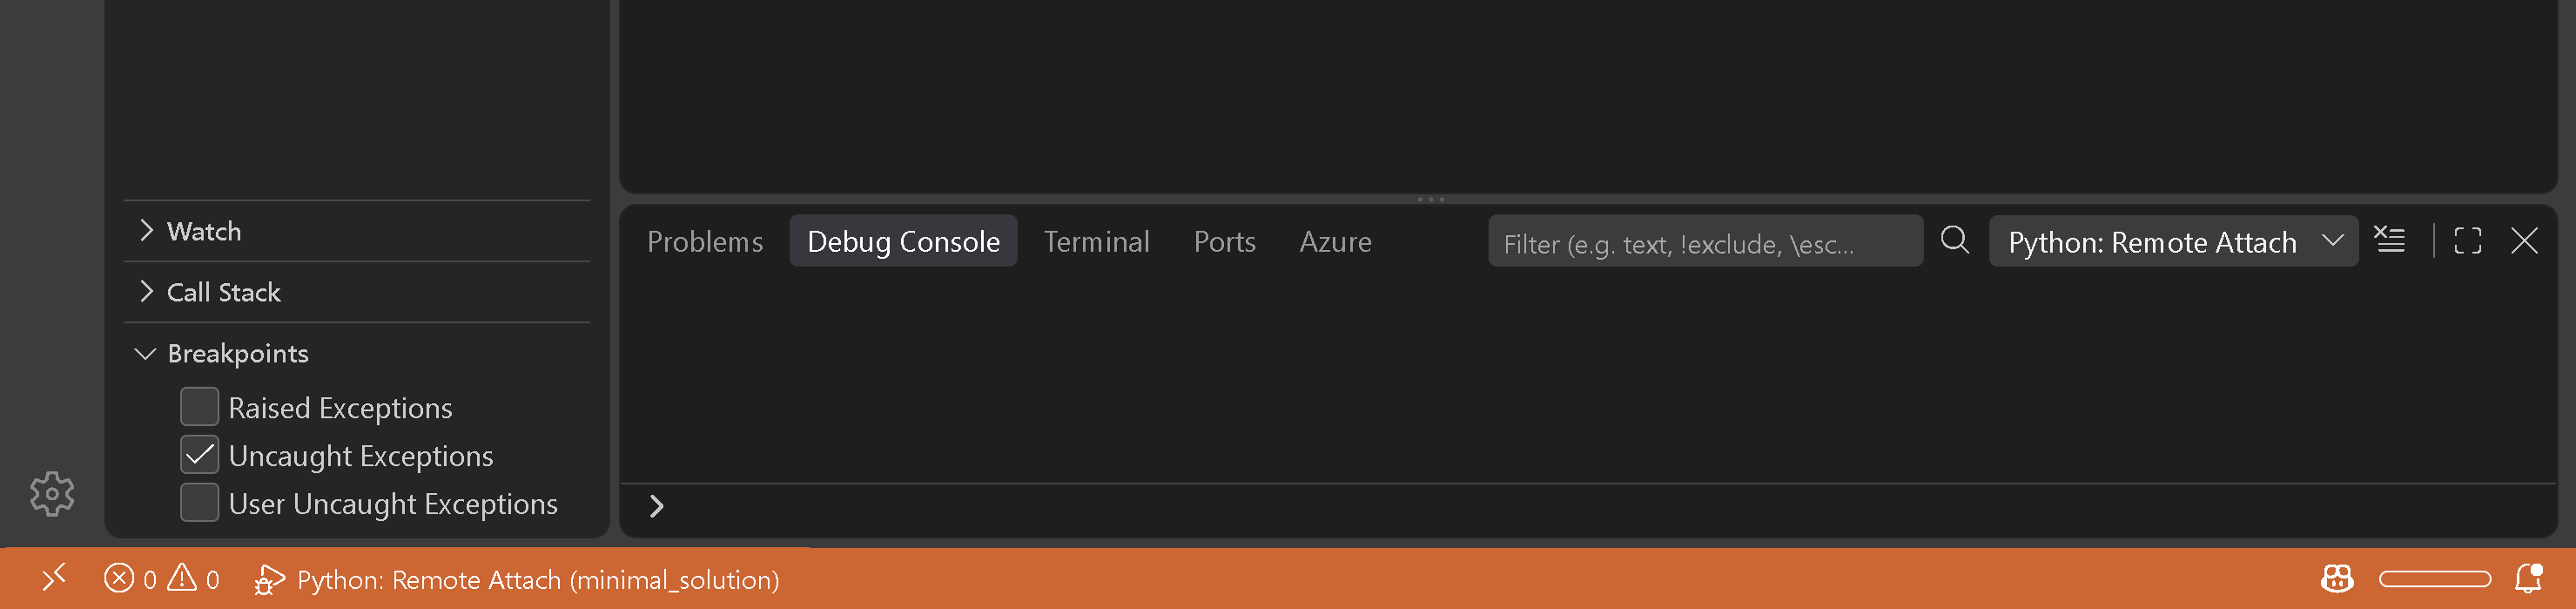
Validate that the debugger is attached by checking the VS Code status bar and Debug Console.
Result
After attaching the debugger, you should see:
The VS Code status bar shows: Python: Remote Attach (<name-of-your-solution>).
The Debug Console indicates a successful connection.
The Run and Debug panel shows that the solution API process is running.
Step 3: Set a breakpoint#
Set a breakpoint in a transaction method by clicking the gutter to the left of the line numbers:
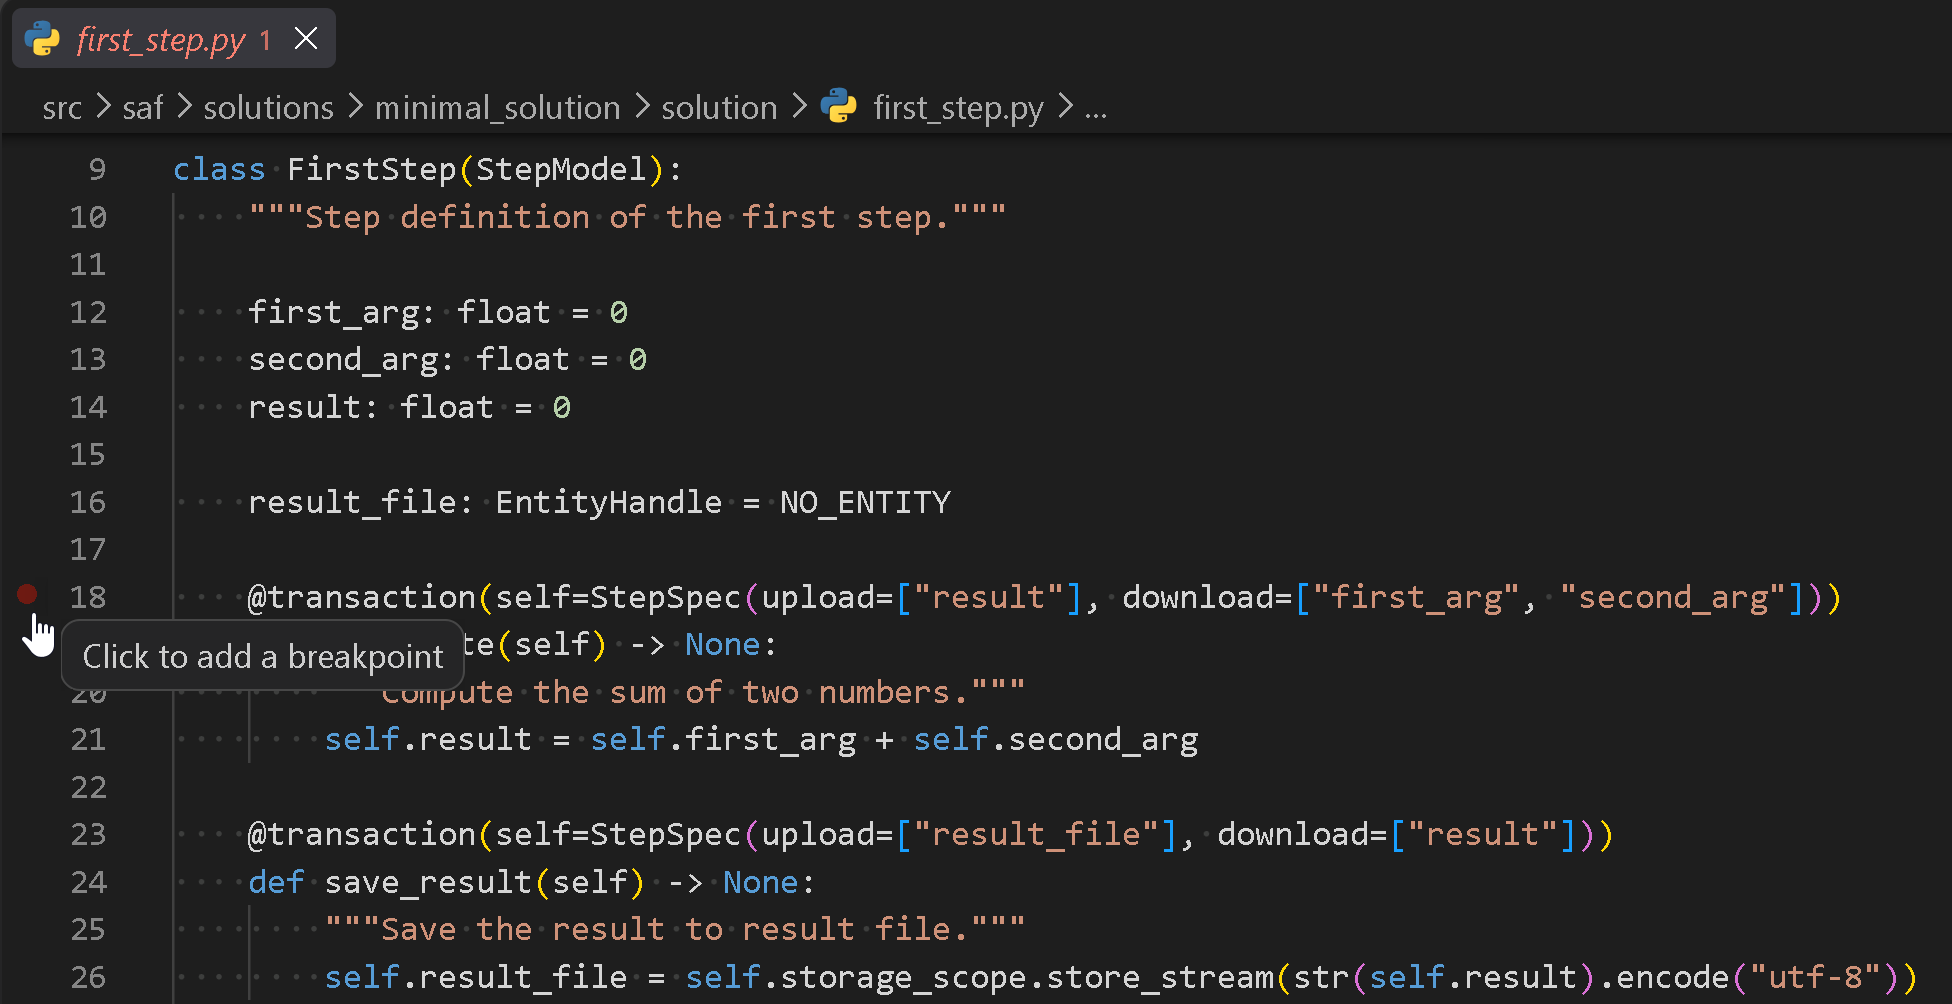
Invoke the transaction method using the solution UI or the API swagger interface.
This causes the debugger to pause at the breakpoint in the method.
Result
When the breakpoint in the transaction method is hit:
The debugger pauses execution at the breakpoint and highlights the paused line in the editor.
The Call Stack pane shows the current stack and the Variables/Locals panes are populated for the active frame.
Step Over / Step Into / Continue controls are enabled and you can evaluate expressions in the Debug Console.
Debugger port#
Automatic port selection#
By default, SAF GLOW Engine uses port 5724 for backend debugging.
If multiple processes are run simultaneously or the port is used by another non-GLOW process, then SAF GLOW Engine attempts to find an available port dynamically.
To find the port being used, check the GLOW API logs:
Find the line containing
#### API server listening for debug on port: 5724 ####.Note
The API server logs the debug port on startup. Look for a line like:
#### API server listening for debug on port: 5724 ####
If the port differs, update your launch configuration or set
GLOW_DEBUG_API_PORTto a fixed value.If the port is different than 5724, then modify your Python: Remote Attach debug configuration accordingly, setting the
portkey with the value obtained from the log line:{ "name": "Python: Remote Attach", "type": "python", "request": "attach", "connect": { "host": "localhost", "port": "$PORT_FROM_LOG" }, "justMyCode": false }
See also
For more information about the configuration file, see Visual Studio Code’s Python debugging instructions .
Manual port selection#
You can specify a particular debug port by setting the GLOW_DEBUG_API_PORT environment variable and then modifying the
Python: Remote Attach debug configuration to refer to it.
Set the
GLOW_DEBUG_API_PORTenvironment variable to the port you want to use.In the
launch.jsonfile found in the.vscodefolder at the root of the project, set the key value of theportto the value ofGLOW_DEBUG_API_PORT:{ "name": "Python: Remote Attach", "type": "python", "request": "attach", "connect": { "host": "localhost", "port": "${env:GLOW_DEBUG_API_PORT}" }, "justMyCode": false }
If the specified port is unavailable, SAF GLOW Engine cannot use it, resulting in a connection error and subsequent shutdown.